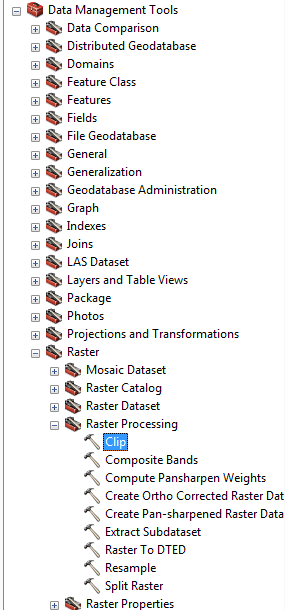
So you find yourself in a position where you have to make DEMs, but, like me, it’s been a while since you had to make one and are now sweatting as you peruse through the seemingly infinite menus and submenus of ArcGIS.
Displaying DEM data (bathymetry, elevation, georeferenced data points, etc.) on ArcGIS from a text file.
You have exported your georeferenced (yeah?) elevation (yeah?) data from that super simple program (ha) and now you’re at a loss for what to do with it in GIS. Here’s what you do:
To start with, DEM data generally comes in the ‘.txt’ format which is delimited (separated) using commas, and without spaces between the values (unless it is delimited using spaces). At the top you have a row of text which serve as column headers, which allow you to select that column of values within Arc.
- Import data using the ‘Add data’ function.
- Right click the imported file, select ‘Display XY Data’.
- If you have the appropriate headers in the text file you should be able to input your X, Y and Z fields (Easting, Northing, Depth etc.).
- Right click the new layer, select ‘Export Data’.
- This should be exported as a ‘.shp’ file.
- If this doesn’t work, select ‘Display XY Data’ again with the ‘Events’ file output from the previous steps.
- Follow steps 3 and 4, this should now work.
- After this, you can convert feature to raster.
If you want to use the bathymetry later, you can export to a TIFF (georeferenced, often called a GEOTIFF) using the export function (right click the raster layer you just made and export, select TIFF as the output filetype if not already selected).
Making a super professional hill-shaded bathymetry
- Complete the ‘Displaying DEM data’ section, click and drag the TIFF into ArcGIS.
- Select the ‘Jet’ colour scheme (or which ever colour scheme you desire) for the bathymetry
- Make a hillshade of the bathymetry (3D Analyst > Raster Surface > Hillshade).
- You can leave the ‘Azimuth’ and ‘Elevation’ values as they are, you can alter the ‘Z’ factor to increase the vertical exaggeration of the hillshade. I usually set that to 3.
- Right click the hillshade, select properties.
- In the ‘Display’ tab, you can change the transparency of the hillshade. I like to use 30% but you can play around with it if you wish.
Displaying XY data by category
Sometimes you may have the XY locations of different types of variable (i.e. waypoint, sampling location, mooring location, etc.). If you add a column into the header row of the text file named ‘Types’, for example, you can add the ‘waypoint, sampling location, decent pubs, etc.’ labels to each row and this will be the categories which you sort the XY points into within Arc.
- You can import all of the XY coordinates into Arc and convert to shape files using the above method.
- Right click the layer of XY coordinates and select the ‘Symbology’ tab, in there you can select the ‘Categories > Unique Values’, or ‘Unique Values, many fields’ if you have different variables. Using this you can add in each of the categories you put into the text file.
- Be sure to choose an appropriate symbol for each category by double clicking each of the ‘point’ symbols and scrolling through the symbols until you find the desired symbol.
Converting elevation to depth
You just made a sweet bathymetry output from Caris or Fledermaus or whatever and oh no(!), the values imply elevation (+ive) rather than depth (-ive). Here’s a sneaky tip for getting around that without having to export your data again.
- Import your elevation data using the above method.
- Convert to depth using the raster calculator (Spatial analyst > Raster Algebra (?) > Raster Calculator).
- Double click, or drag, your elevation layer so it appears in the box below the layer list.
- Using the calculator function to the right, multiply the elevation layer by -1.
- This method can be used to convert depth to elevation also.
Sneaky sneaky!
Taking repeat elevation (or depth) profiles from the same point.
This assumes that you have a repeat elevation or bathymetry survey ongoing.
- First you must make a line shape file (See Previous Post on how to make a shape file) and position the line in the spot you want, usually across or along the axis of a channel.
- Stack Profile > Right click > Batch process.
- It will output everything into a single table, but you can export this to an excel or text file to use in Matlab or something.
- I will make an additional post explaining how to code for that when I get around to figuring it out
Georeferencing an elevation/bathymetry
So you received a new bathymetric survey, you go to import it into Arc and you discover that the survey has an obscure, unique georeferencing system that you can’t get a hold of. Or you have an aerial photograph that you want to georeference. What ever your issue, here’s how to fix it.
- There is a tool called ‘Georeference’.
- I’ve not used this tool much but I’m just letting you know it exists.
General tips:
If you can’t find a function, click on the search bar and type in a function name. It could be there! E.g. I needed to flip a bathymetry so I typed in ‘flip’ and both ‘flip’ and ‘mirror’ functions came up in the results. They weren’t useful for what I wanted but sometimes, life gives you digital lemons.
Always make sure the coordinate systems (e.g. WGS84) match up. Sometimes you have to convert the coordinate system, which is a bit of a headache, but there are websites online that can do this for you (e.g. http://www.earthpoint.us/Convert.aspx).